You can display a chart inside a table cell by inserting a chart shortcode (e.g. [wpdatachart id=1]) into a string column—this works great for use cases where you want to add a small chart next to your data rows.
Enable “Parse shortcodes in strings”
Go to wpDataTables > Settings > Main Settings, and make sure the option “Parse shortcodes in strings” is enabled.

Add a column in your data source
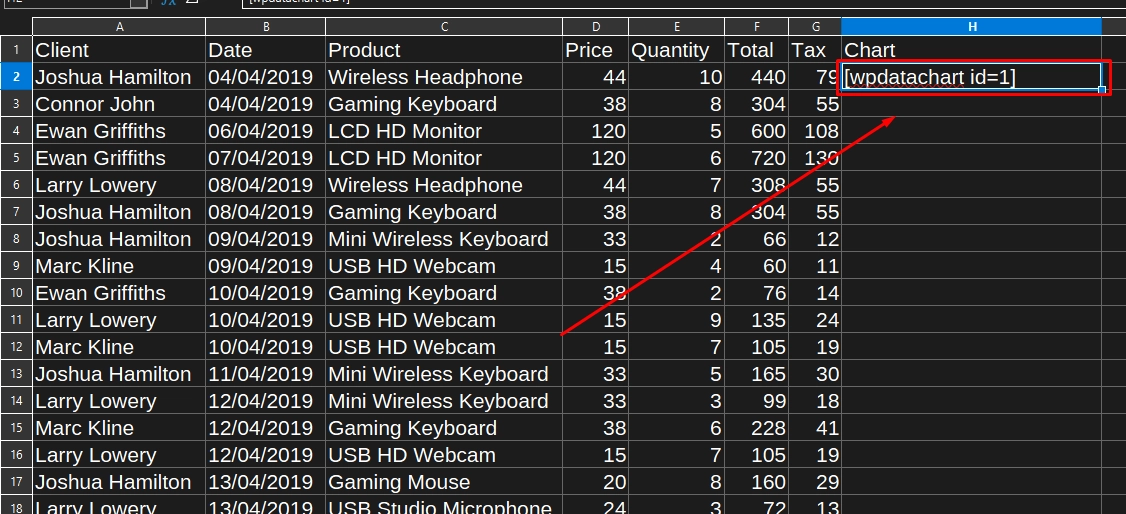
For example, if you’re using an Excel file, add a column named “Chart” (or anything you like), and insert a chart shortcode in a cell such as:[wpdatachart id=1]
Link your table to the data source
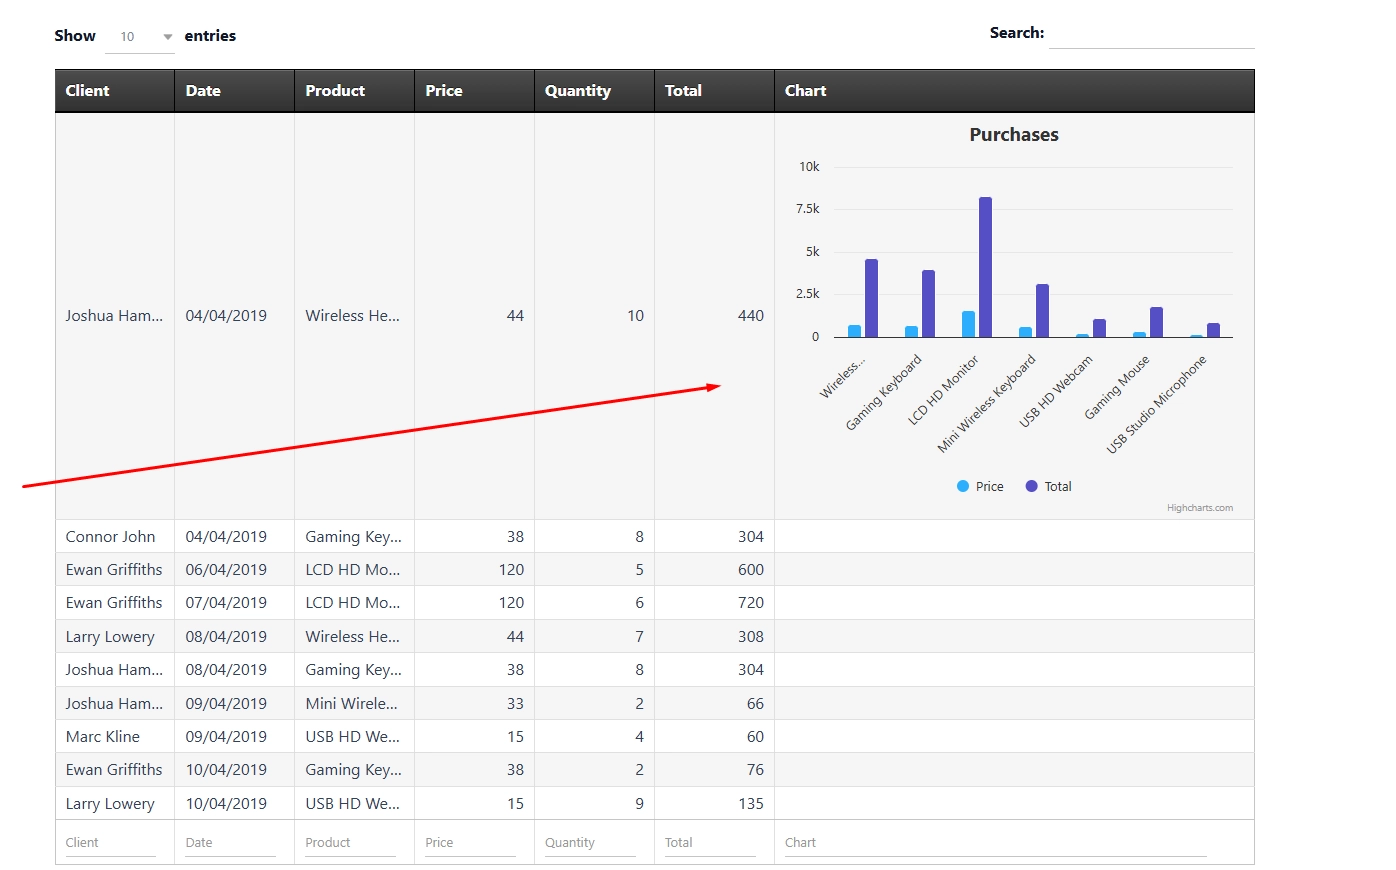
Create a new table in wpDataTables using your updated Excel file, and the chart shortcodes will be rendered automatically inside the cells.
✅ Works with:
Simple tables
Tables linked to data source, such as Excel, CSV, Google Sheets, MySQL, JSON, PHP Array etc.
SQL Query-based tables (only if server-side processing is disabled)
⚠ Limitations:
❌ Does not work with server-side processing enabled, as shortcodes cannot be parsed during AJAX requests.
❌ Manual tables do not support rendering charts inside cells using shortcodes.