By default, charts won’t follow table filtering unless they’re on the same page as their source table.
But good news! 🎉 You can still make a chart respond to filters—even if you don’t want to display the table itself.
To achieve this, just insert both the table and the chart shortcodes on the same page, and enable “Follow table filtering” in the chart's settings (via Chart Wizard).
Then, choose one of the two workarounds below depending on whether you want to hide everything, or just the table body:
Use this if you want only the chart visible—no table, no filters.
On the page, add both the table and chart shortcodes.
In the table settings, go to:Customize → Custom CSS
Add this CSS to the Table’s settings/Customize/Custom CSS:
.wpdt-c .wpDataTables.wpDataTablesWrapper {
    display: none !important;
}
🟢 Result: The table will be completely hidden, but the chart will still respond to filters (e.g. via URL parameters or programmatic filtering).
Use this if you want the chart to stay on the page with column filters, but without showing the table itself.
In table settings:
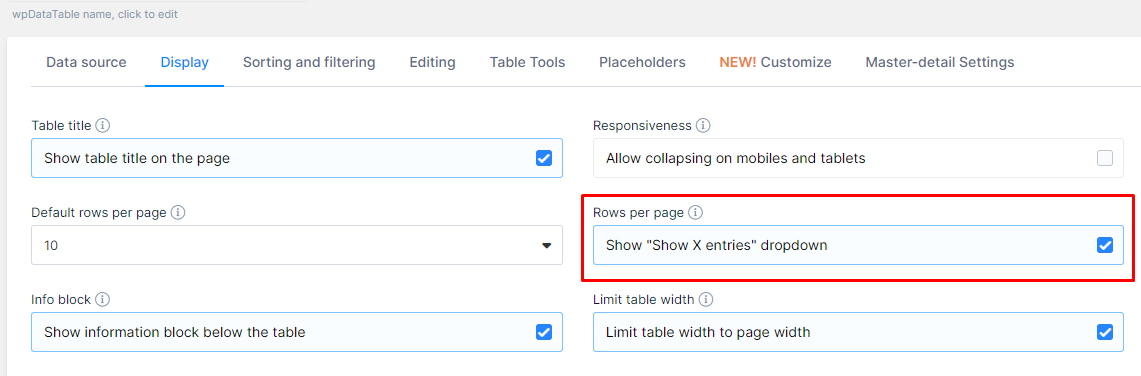
Go to the Display tab and disable:
"Show X entries" dropdown
"Info block"
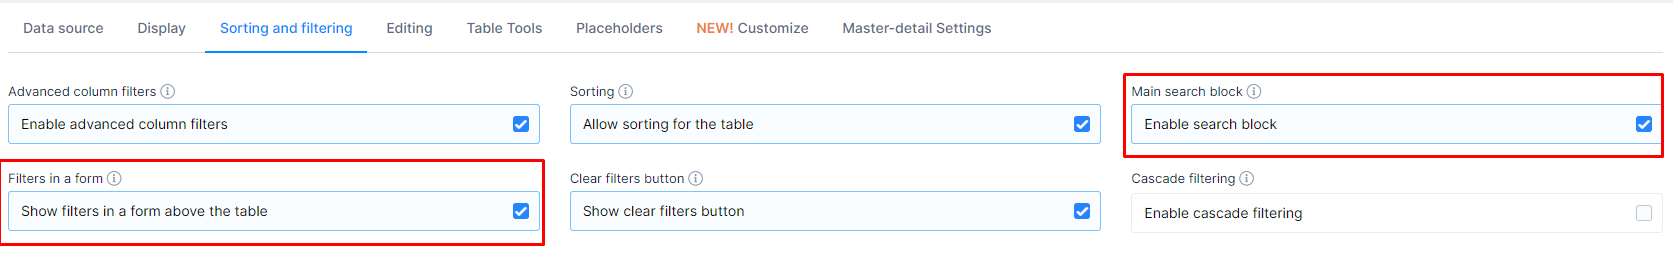
Go to the Sorting and Filtering tab and enable:
"Main search block"
"Show filters in a form above the table"
Then, add this CSS in the table settings/Customize → Custom CSS:
.wpdt-c .wpDataTablesWrapper table {
display: none !important;
}
🟢 Result: Filters remain visible above the chart, and the chart dynamically responds to user filtering input.
🎯 Final Tip:
These workarounds rely on the chart being tied to a visible (or invisible) table on the same page. So always include both shortcodes together—even if one is hidden!